THIS ARTICLE REFERS TO HISTORICAL ICE-ON DATA AND SHOULD NOT BE USED FOR DETERMINING SAFETY OF CURRENT CONDITIONS
From Scott Otterson, Cedar Lake
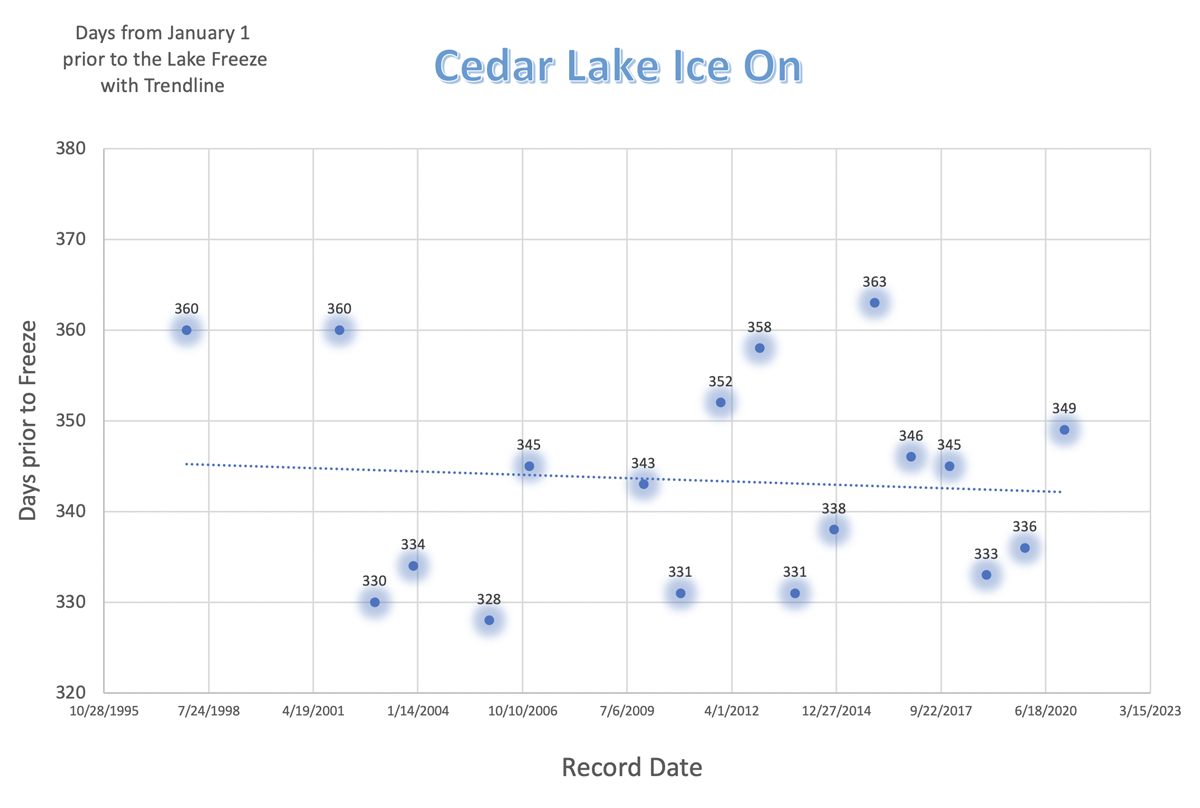
The lake has frozen over and the “Ice On” data will be submitted to the DNR to expand our lake’s database. Below is a chart showing my historical records of when Cedar Lake froze over. The chart shows the variability of the lake freezes.
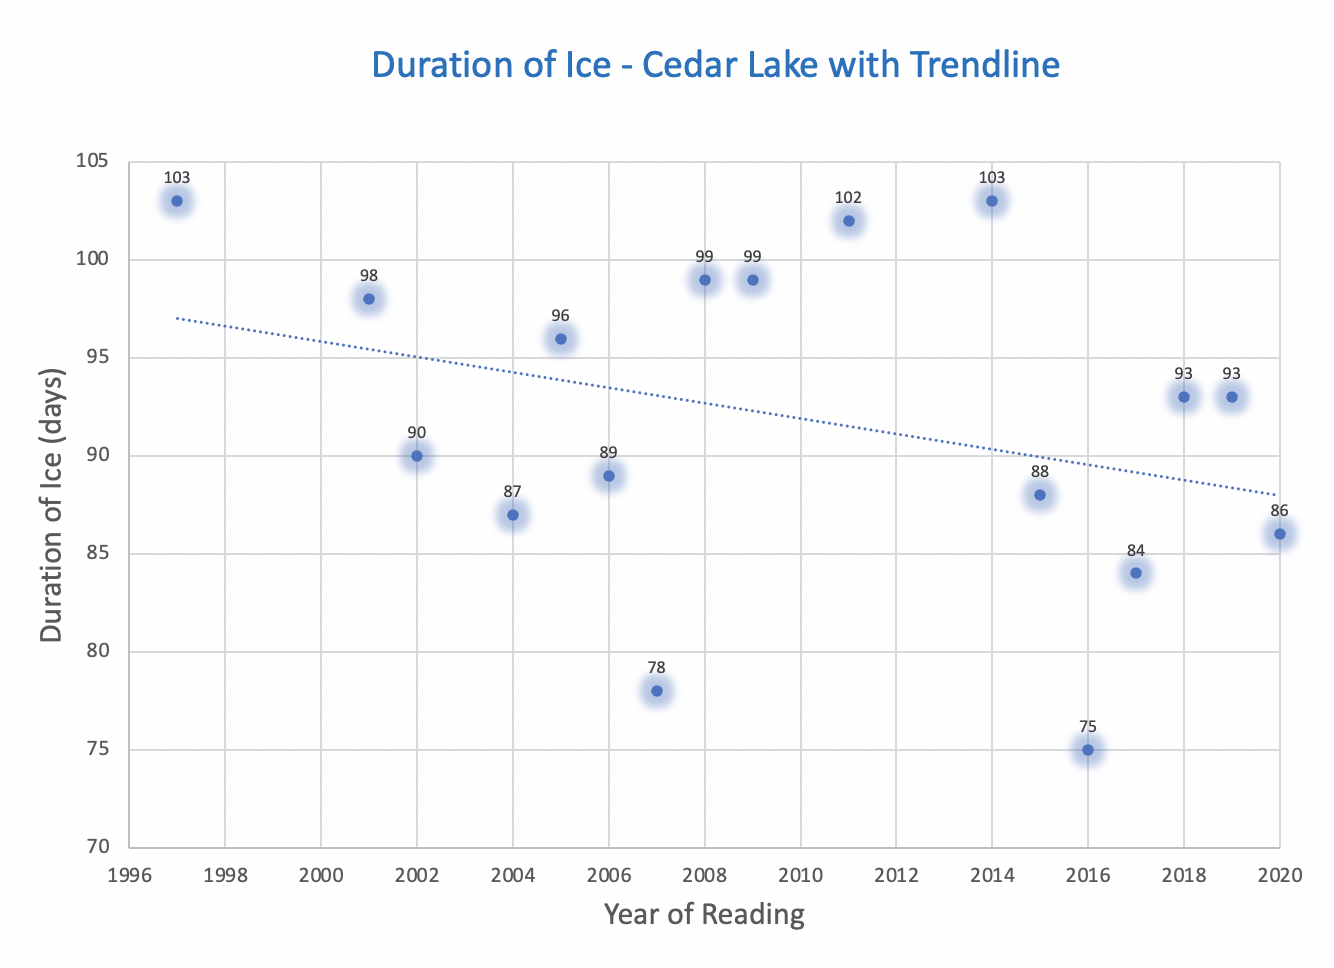
I also calculated the duration of the ice on the lake. I used my records of when Cedar Lake froze and the following spring when the lake’s ice broke up. You will see on the chart from the trendline that the ice duration seems to be shortening. The trendline shows that the duration of ice on the lake has reduced 7 days over the last 20 years.
This duration shortening has been documented by scientists most notably on Lake Mendota in Madison. They predict that the trend in 50 years will create a climate here similar to what is currently in Arkansas. This climate warming also appears to be affecting the forests as the pine tree limits appear to be shifting northward.
See you on the ice,
Scott Otterson


